Overview
Abstract
The BioGears® Endocrine System is a basic system implementation of endocrine signaling. There are currently three hormones included in the BioGears Endocrine system: epinephrine, glucagon, and insulin. The effects of epinephrine are modeled by leveraging the BioGears pharmacodynamics model. The insulin/glucagon model has regulatory effect on the concentration of glucose in the blood, and thus controls many of the nutrient storage/burning/diffusion/synthesis models.
System Design
Background and Scope
The Endocrine System’s primary function is to release hormones to maintain homeostasis and regulate body functions, including metabolism, growth and development, reproduction, and behavior. The human body’s multiple endocrine glands release a variety of hormones. Different endocrine glands respond to stimuli by stimulating synthesis or inhibiting the release of hormones. In general, hormone release is described by a negative feedback mechanism, meaning the effects of the hormone on the physiology cause a cessation of further hormone release. Positive feedback can occur with some hormone release, which leads to more hormone release as the physiologic effects of the hormone are felt. Positive feedback mechanisms are generally isolated to sexual and reproductive hormones [134]. The BioGears Endocrine System will affect metabolic function, renal function, ion regulation, and sympathetic stimulation. The engine does not attempt to model growth, sexual, or reproductive hormones.
Data Flow
Reset, Conditions, and Initialization
Hormone values are initialized where necessary during reset. The Endocrine System contains models for diabetes mellitus, both types 1 and 2. The diabetes type 1 condition is active, while the type 2 condition is planned for a future release.
Preprocess
Currently, all Endocrine functionality occurs in Preprocess. Epinephrine, insulin, and glucagon are all released in their own methods here.
Process
There is no system-specific function for Process in the Endocrine System.
Post Process
There is no system-specific function for Post Process in the Endocrine System.
Assessments
There are no assessments in the Endocrine System.

Features, Capabilities, and Dependencies
The BioGears Endocrine System currently contains three hormones: epinephrine, glucagon, and insulin. Each of these hormones is released endogenously and is cleared at a specified rate. The release rate of insulin and glucagon is determined by the concentration of glucose in the blood, and the release rate of epinephrine is perturbed from the basal rate by two actions: exercise and acute stress.
Insulin
Insulin is secreted by the pancreatic beta cells in response to increased blood glucose. The model utilized for insulin synthesis was obtained from a full-body insulin and glucose feedback model [353]. The synthesis rate is defined by:
\[f(G)=\frac{R}{1+\exp \left((C-G)\left(\frac{1}{a_{1} } \right)\right)} \]
Where R is the tuned basal insulin synthesis rate in microunits per minute. C is the upper glucose concentration set-point in grams per liter. a1 is the lower glucose concentration set-point in grams per liter.
The equation gives the insulin synthesis rate in microunits per minute as a function of the blood glucose concentration in grams per liter. The remaining parameters are tuning constants that were adjusted to achieve the correct insulin response. Because the BioGears Cardiovascular System does not contain a pancreas compartment, the insulin is synthesized directly in the splanchnic. It utilizes the glucose concentration in the aorta to determine the amount of insulin to be synthesized. Insulin clearance was determined empirically at a value that allows blood concentrations to remain steady when blood glucose remains steady at 90 mg/dL.
Insulin does not have any effects attributable to the BioGears pharmacodynamic model. Its only purpose in BioGears is to modulate the usage of nutrients in the body.
Glucagon
Glucagon is a peptide hormone secreted by the pancreatic alpha cells. It can be considered the "opposite" of insulin in that its secretion is stimulated by low blood glucose. Glucagon synthesis utilizes the same form as Equation 1 above for insulin. Whereas insulin synthesis was directly modeled from literature values and had clearance set empirically, glucagon has a validated clearance rate of 9 mL/min*kg from [6], which was used to empirically set a synthesis rate. The same method was used to get stable glucagon blood concentrations when glucose is held steady at 90 mg/dL.
Epinephrine
Epinephrine is released by the adrenal medulla at a basal endogenous rate of approximately 0.18 (μg/min) [22]. To enable patient variability, BioGears uses a mass-normalized basal epinephrine release rate of about 0.003 (μg/kg-min). Because BioGears does not have an adrenal gland compartment, epinephrine is released equally from the kidneys' efferent arterioles. The epinephrine clearance rate in BioGears is constant and will not change with concentration (note that the actual amount cleared is a function of the concentration as well as the hemodynamics). A basal clearance rate of 68.7 (mL/kg-min) was computed from the basal release rate and by assuming a steady-state normal concentration of 0.032 (μg/L) [403]. The basal clearance rate is a property of the epinephrine substance in BioGears; therefore, the clearance rate can be adjusted in the epinephrine substance file to achieve a desired steady-state concentration. A wide range of normal basal epinephrine concentrations are reported in literature [403] [340] [335] [258] [412].
Two stimuli, exercise and acute stress, can modify the epinephrine release rate.
Exercise
The increase in epinephrine release as a function of above-basal exercise was developed using data in [340] and [350]. We assume that the epinephrine clearance rate is constant; therefore, the fractional increase in epinephrine concentration described in [340] and [350] can be assumed to be due to a similar fractional increase in release rate. Using that assumption, we fit a logistic function to the basal-normalized epinephrine steady-state concentrations during exercise presented in [350]. The release modifier varies from 1 to 19.75, as shown in Figure 2, meaning that the epinephrine release rate will be 19.75 times the basal release rate with maximal exercise. The model is implemented by first computing the above-basal metabolic rate and then using the generic logistic function with the appropriate parameter values to compute the release rate multiplier.

The whole-body physiological response to exercise is compared to empirical data in the exercise validation section of the Energy Methodology report.
Acute Stress
Acute Stress is an action that causes an increase in the basal production of epinephrine. For details see the Actions section of this document.
The pharmacodynamic effects of epinephrine are applied using the sigmoid 'Emax' model described in phamacodynamics section of the Drugs Methodology report. Maximum effects for the model were derived from data in [52], [340], and [350]. Note that these researchers were examining the relationships between epinephrine and exercise, and not the relationships between epinephrine and acute stress. For that reason, the model of epinephrine release during the acute stress action is more phenomenological.
Hormone Factor
The hormone factor is a calculated metric relating the change in insulin and glucagon from their baseline values. Because many processes in the Hepatic, Gastrointestinal, and Tissue Systems are controlled by insulin and glucagon, and because they behave in largely antagonistic ways, a method was needed to quantify the change of one with respect to the other. Thus, the "hormone factor" was introduced. Its caluclation can be seen below in Equation 2.
\[HF=\frac{I_{t} -I_{0} }{I_{0} } -\frac{G_{t} -G_{0} }{G_{0} } \]
Where It and Gt are insulin and glucagon vascular concentrations in a given compartment at a given time, I0 and G0 are post-stabilization set points for concentration in a given compartment, and HF is the resultant hormone factor. When there is no perturbance of the system, the hormone factor is expected to stay near 0. When the system is perturbed, either by increased blood glucose when eating a meal or decreased blood glucose in response to metabolism, the hormone factor responds accordingly. For details on the implementation of the hormone factor, see Hepatic Methodology and Tissue Methodology.
Dependencies
The Endocrine System is dependent on the key systems of the BioGears Engine. The Endocrine System is dependent on the metabolic rate determined in the Energy System. The insulin and glucagon synthesis rates are dependent on the concentration of glucose in the Cardiovascular System, which fluctuates depending on changes in the Gastrointestinal and Tissue Systems.
Assumptions and Limitations
Epinephrine has a variety of effects in the human body, but all of the effects do not occur at the same epinephrine concentration thresholds. For example, a patient with a slowly increasing blood concentration of epinephrine would experience an elevated heart rate before they experience a decrease in diastolic pressure [52]. The current state of the BioGears pharmacodynamic model cannot replicate this behavior, and so a threshold was chosen to minimize overall error. Furthermore, it is known that there is interplay between the blood concentration of epinephrine and that of glucose and insulin, but this interaction is not modeled. Another effect of the current pharmacodynamic model is that a higher concentration of epinephrine is needed in the blood to evoke the desired responses for an acute stress action. Additionally, the clearance rate of epinephrine is constant in BioGears, whereas there is evidence that the clearance rate of epinephrine changes with blood concentration [52]. BioGears does not currently model the physiological effects of epinephrine deficiency, so a diminished blood concentration of epinephrine will have no effect in BioGears. Finally, the only physiologic trigger for increased epinephrine release is exercise. Many insults modeled in BioGears are known to cause increased concentrations of epinephrine due to pain or stress, but this release is not directly included in those insult models. Instead, a separate Acute Stress action must be specified to account for this epinephrine release.
The insulin and glucagon response is currently only dependent on the blood glucose level. In reality, synthesis is dependent on both blood protein and blood glucose concentrations. The current dependence on just blood glucose is a reasonable assumption, because the resting synthesis rate has been accurately validated. This assumption holds true unless a meal consisting of only protein occurs.
The design of the endocrine system favors normal resting physiology, and doesn't perfectly replicate agitation. For example, when eating a glucose-heavy meal, the blood glucose level doesn't rise and fall as would be expected in a brief timescale. This is primarily due to two factors: an insulin synthesis process that responds instantly to glucose fluctuations, and a consumption process that uses free glucose as the highest-priority fuel. These factors work to keep the system in homeostasis at baseline values, and they perhaps perform too well, keeping blood glucose very steady. This also affects conditions like diabetes, where large fluctuations due to glucose consumption are expected, but behavior is a bit less extreme and more steady than expected, and changes require larger simulation times. These limitations will be improved as the Endocrine system is improved in future releases.
Actions
Insults
Acute Stress
The Acute Stress action is used to directly modify the production of epinephrine. In the human body, stress or anxiety causes a sympathetic release of epinephrine and norepinephrine from the adrenal medullae. In BioGears, an Acute Stress action is rated a severity between 0 and 1, and that severity is used to modify the epinephrine release rate linearly. A severity of 0 will return the rate to the normal, basal level, while a severity of 1 will increase the release rate by a factor of 30. This model was chosen to approximate the physiological responses observed during mild pain, mental stress tests, and panic attacks [124] [244] [393].
Results and Conclusions
Validation - Resting Physiologic State
In the BioGears Engine, the hormone epinephrine is the same substance as the synthetic epinephrine available for injection. This generic epinephrine substance was validated as part of the drugs validation detailed in the Drugs Validation's Table 1. At resting physiological levels, epinephrine has no pharmacodynamic effects.
Validation - Actions
Acute Stress
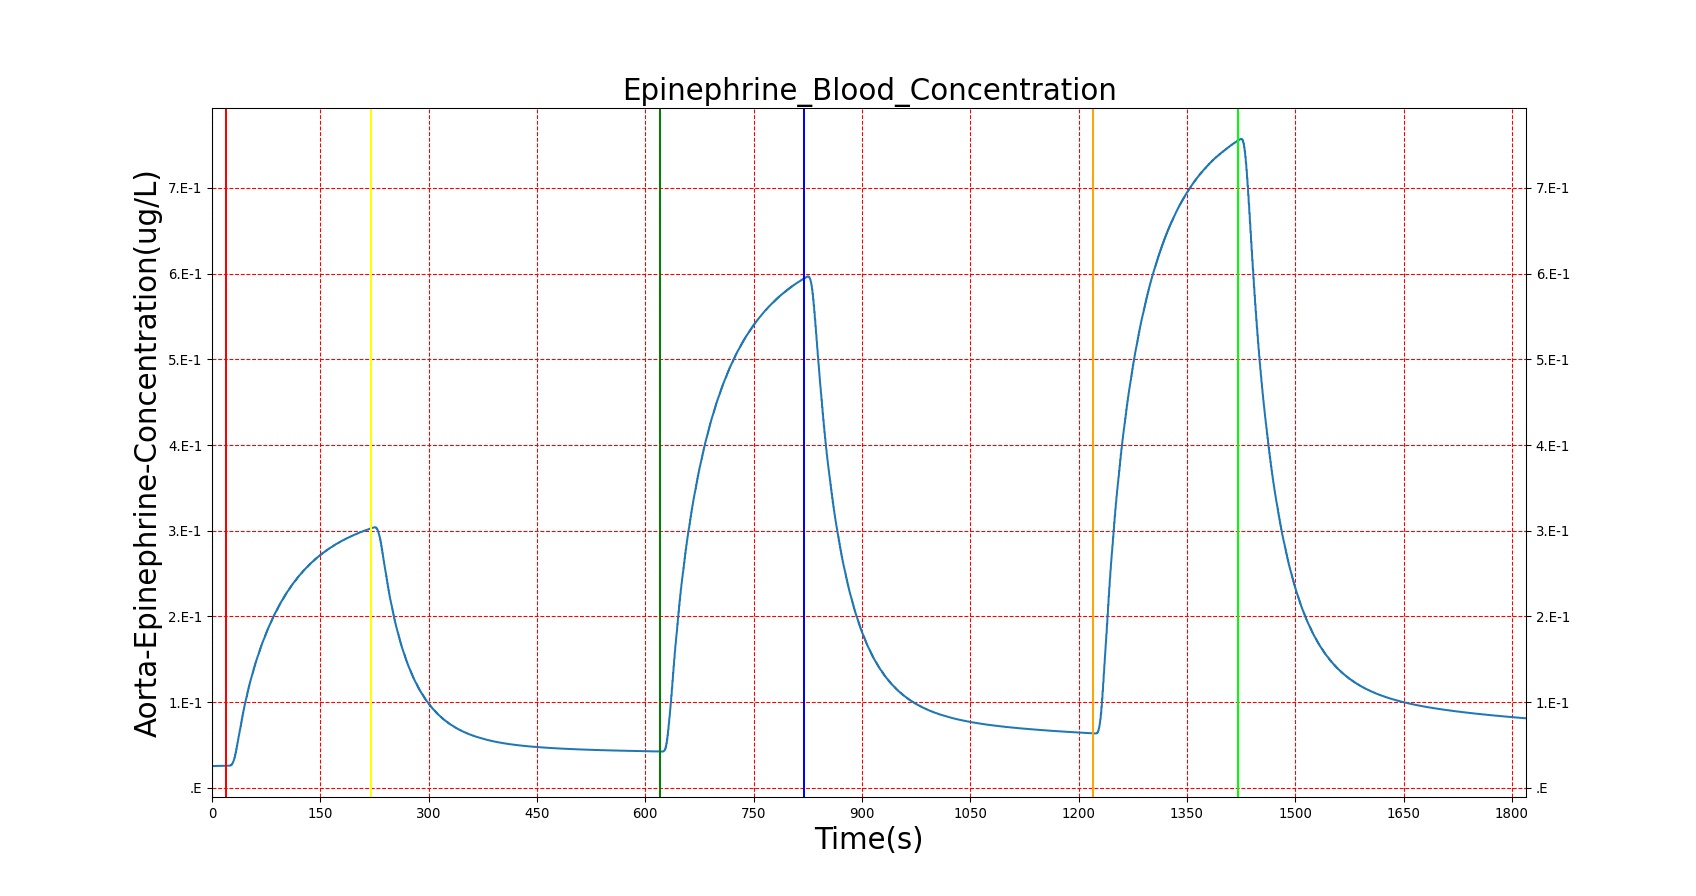
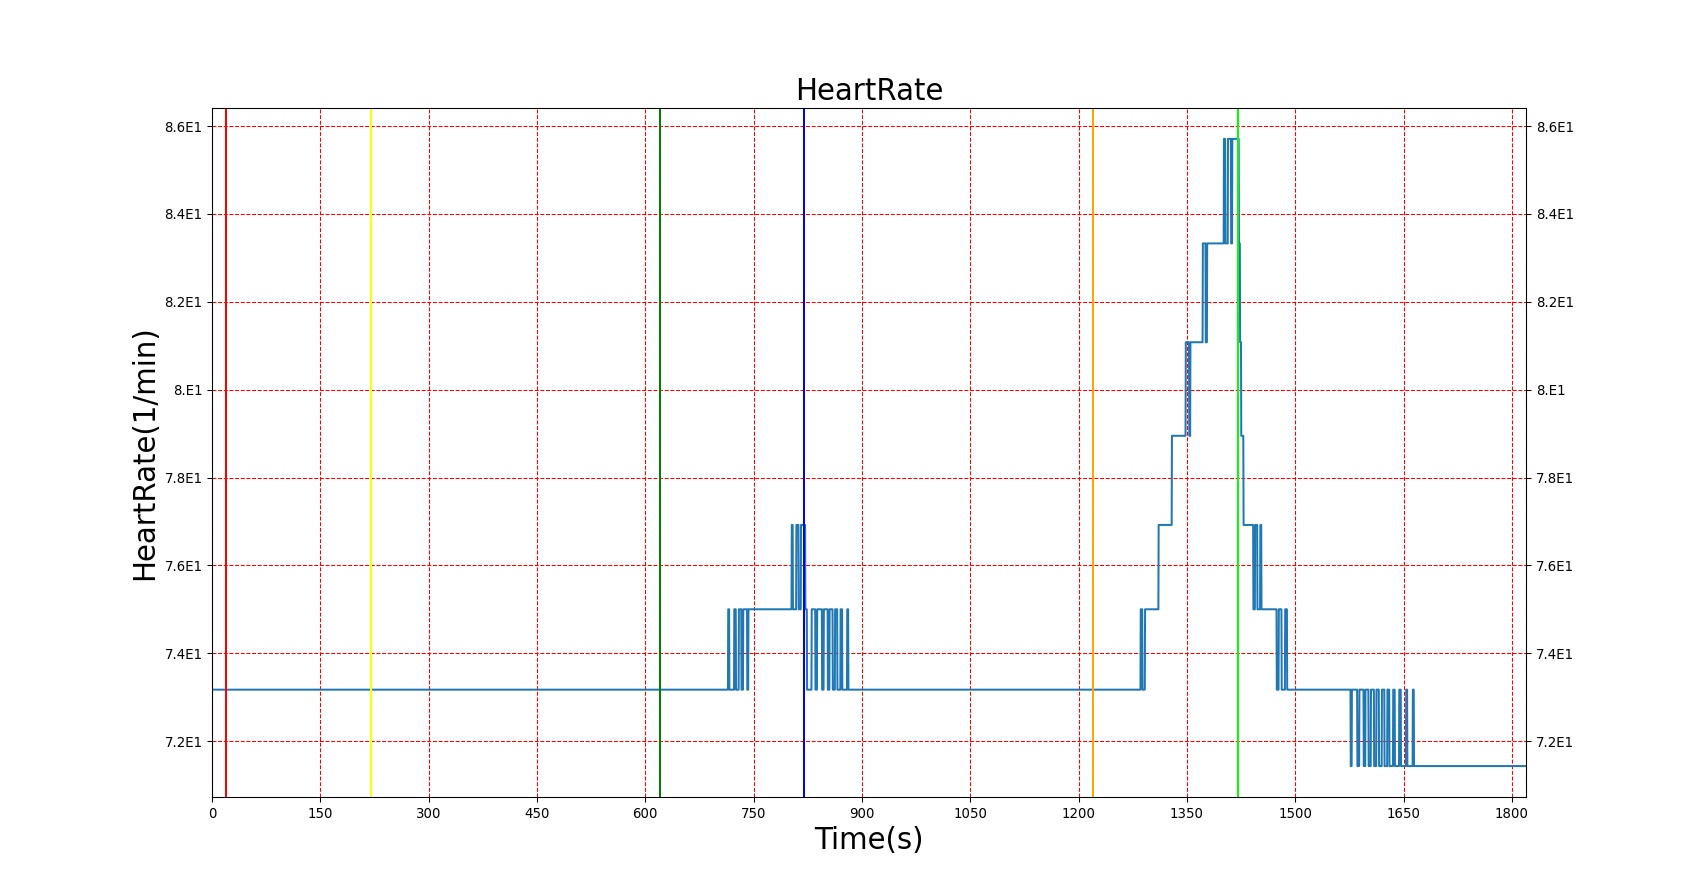
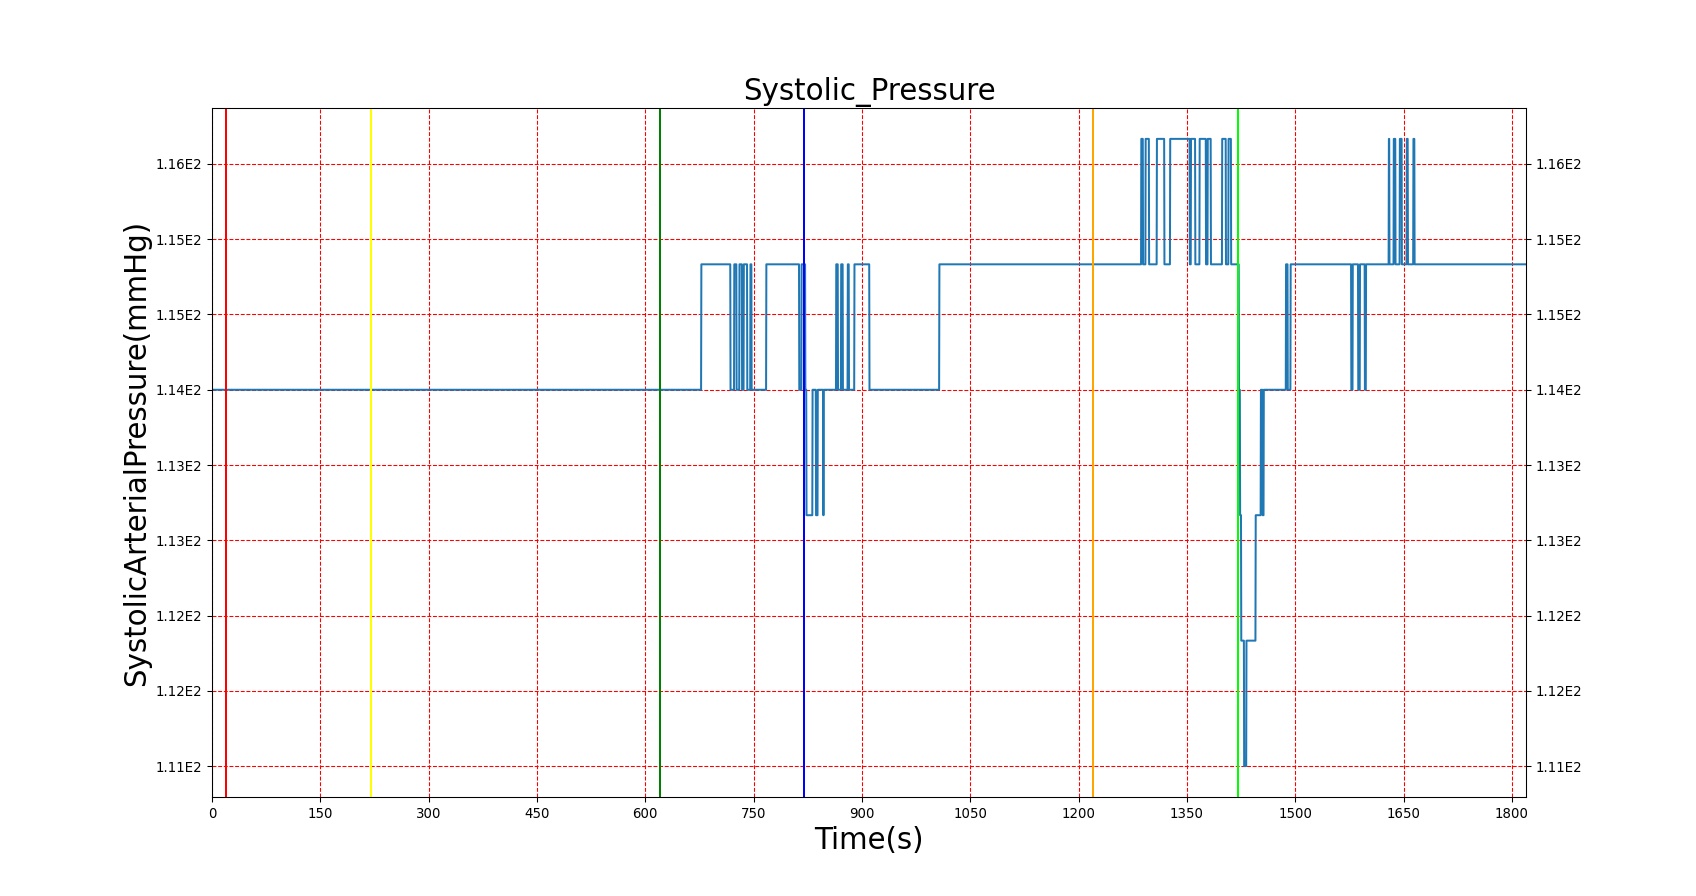
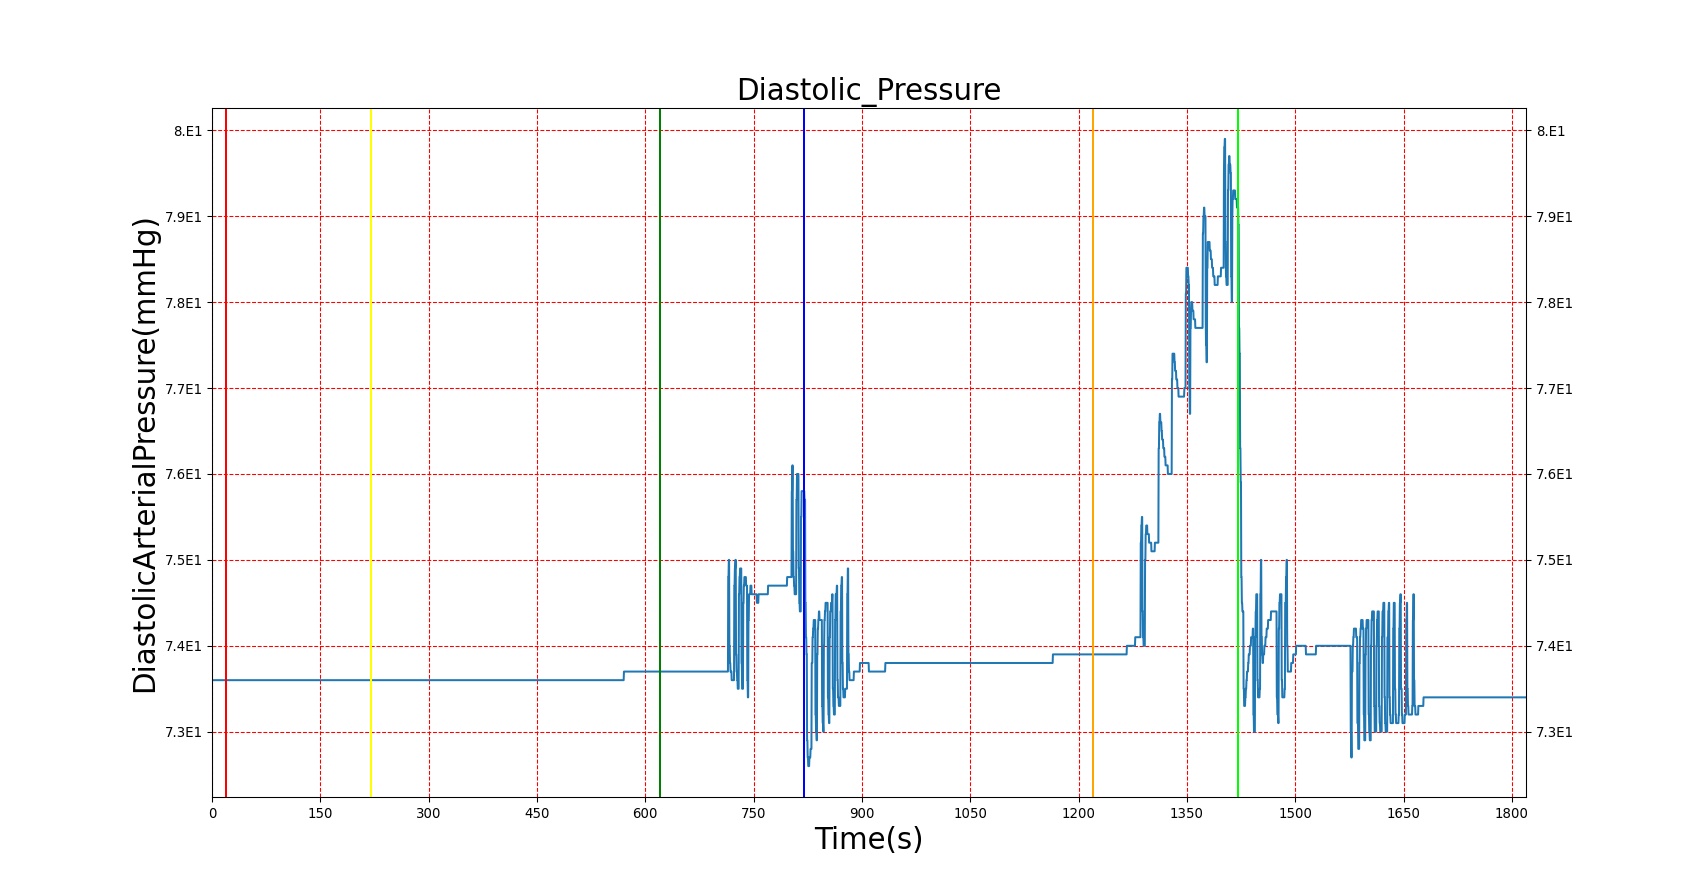
The effects of epinephrine release on the physiology can be clearly seen by triggering an Acute Stress action. The patient in this scenario undergoes three bouts of Acute Stress, with the first representing mild pain, the second representing mental stress, and the third representing a panic attack. The severity levels were chosen by checking the blood concentration of epinephrine to ensure it met published values. However, a known issue with epinephrine modeling in the current BioGears release is that higher concentrations of epinephrine are needed to produce the effects noted in literature. In order to achieve the physiological effects, the severity was proportionally scaled up. This shortcoming is the reason for the failing epinephrine concentrations, but it allows for the other effects of epinephrine to be modeled, which has beneficial effects for other systems utilizing epinephrine. Heart rate behaves as expected, but blood pressure effects aren't always in line with expectations. This is likely an effect of baroreceptor reflex counterbalancing epinephrine effects. Figure 3 shows the blood concentration and select effects with the acute stress action.
| 
|
| 
|
| |
| Action | Notes | Action Occurrence Time (s) | Sampled Scenario Time (s) | Arterial Epinephrine (ug/L) | Systolic Pressure (mmHg) | Diastolic Pressure (mmHg) | Heart Rate (1/min) |
|---|---|---|---|---|---|---|---|
| Acute Stress | Severity 0.4; mild pain | 20 | 210 | 90% Increase [124] Increase [244] | 15 mmHg Increase [244] | 17 mmHg Increase [244] | Increase [244] |
| Acute Stress | Severity 0 | 220 | 610 | .034 ug/L [403] | 100-140 mmHg [376] | 60-90 mmHg [376] | 72 [134] |
| Acute Stress | Severity 0.8; mental stress | 620 | 810 | 37-273% Increase [244] .09 [393] | 15 mmHg Increase [244] 143.8 [393] | 8 mmHg Increase [244] | Increase [244] 82 [393] |
| Acute Stress | Severity 0 | 820 | 1210 | .034 ug/L [403] | 100-140 mmHg [376] | 60-90 mmHg [376] | 72 [134] |
| Acute Stress | Severity 1; panic attack | 1220 | 1410 | 54-199% Increase [393] | NC to Slight Increase [393] | NC to Slight Increase [393] | 85-108 [393] |
Conditions
Diabetes Type 1
Diabetes mellitus type 1, also known as insulin-dependent diabetes mellitus, affects the pancreas gland's ability to produce insulin. An autoimmune response results in the breakdown of the pancreatic beta cells, where insulin is synthesized. The lack of insulin in the body interrupts the body's metabolic mechanisms, resulting in a rise in blood glucose concentration. Another complication of rapid onset is a rise in ketone production, possibly resulting in diabetec ketoacidosis [30].
The diabetes type 1 condition in BioGears works directly on the insulin synthesis in the Endocrine system. A severity value determines the extent of the reduction in endogenous insulin production, with a value of 1 meaning the body produces no insulin, and a value of 0 meaning there is no reduction in insulin production, in which case the condition would have no effect. This value is directly applied to the amount of insulin synthesized each timestep, meaning a patient with a diabetes type 1 severity of .5 would produce half the insulin of a healthy patient at the same blood glucose level.
Because of the way BioGears models the hormone factor, a complete elimination of insulin production without a modification to glucagon would see glucagon production also approaching zero as the blood sugar rises, and so metabolic processes would reach a state much like that in a healthy, fed patient. As shown in [37], patients with diabetes type 1 show acute glucagon responses similar to those in healthy patients, with values tending toward 40 ng/L. Thus, glucagon synthesis is also modified in BioGears when a diabetes type 1 condition is present. Glucagon is allowed to respond normally to blood sugar down to a minimum rate determined by the severity, where production is restricted to an amount that results in a blood concentration of about 40 ng/L in the most severe case, and no impact in a case with 0 severity.
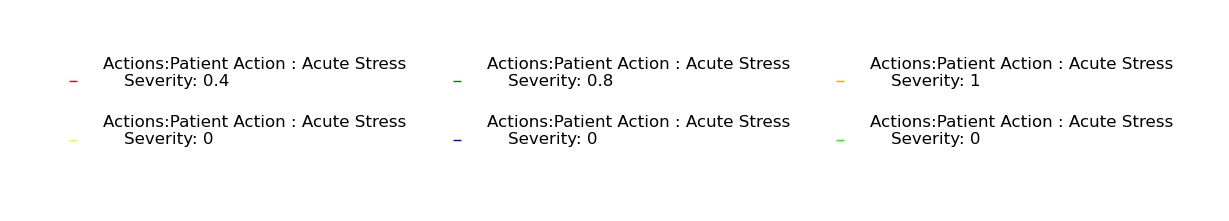
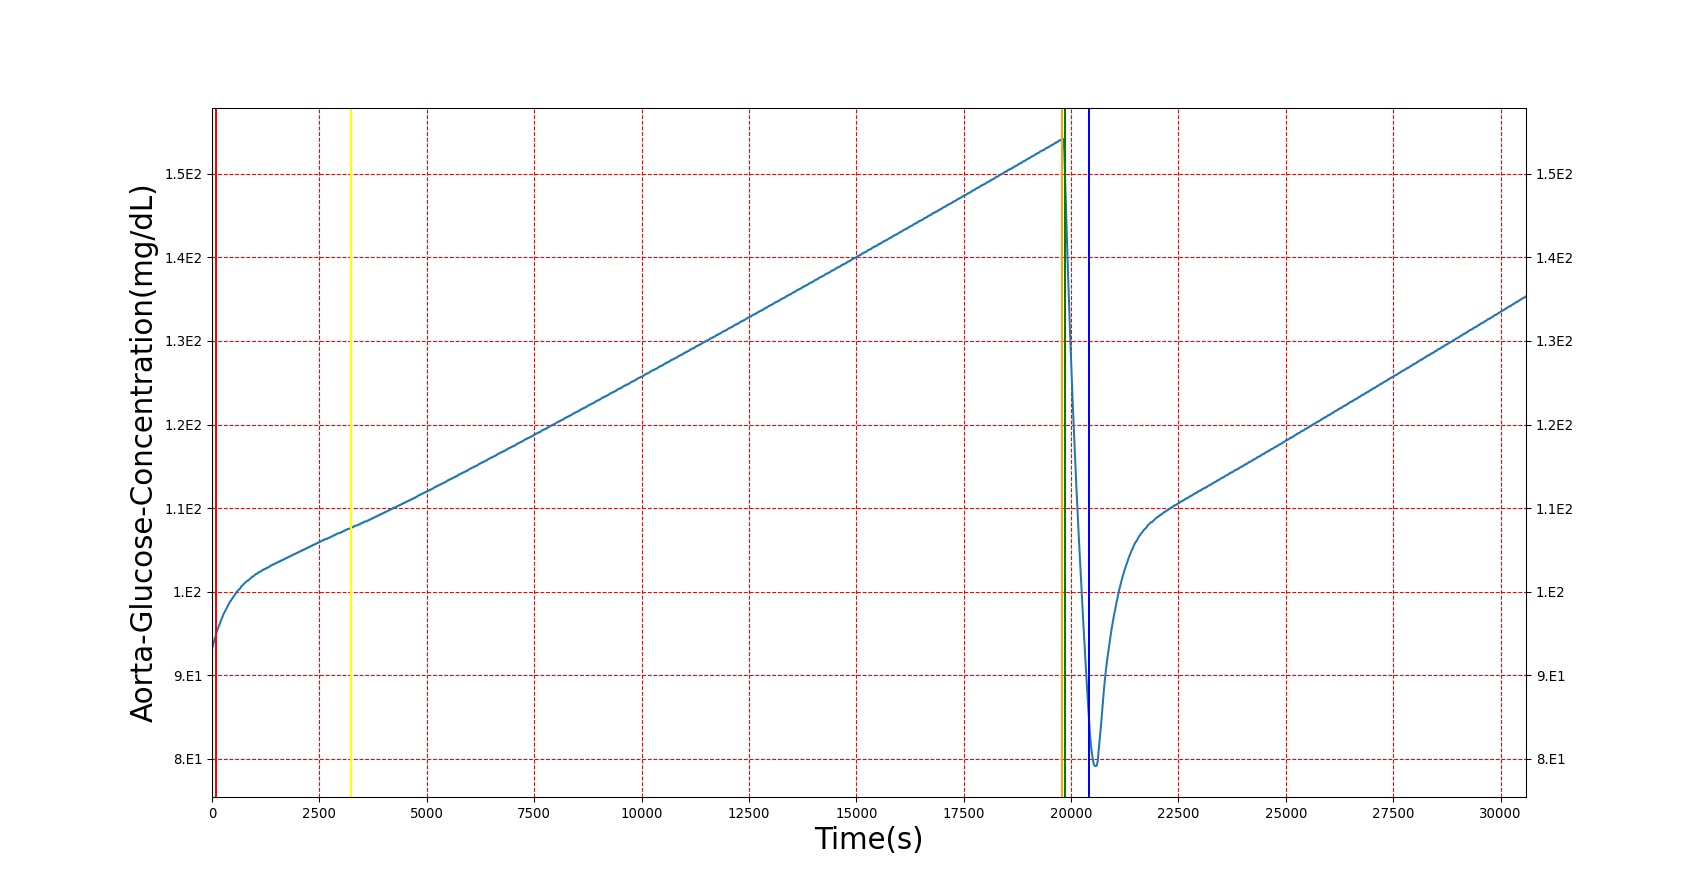
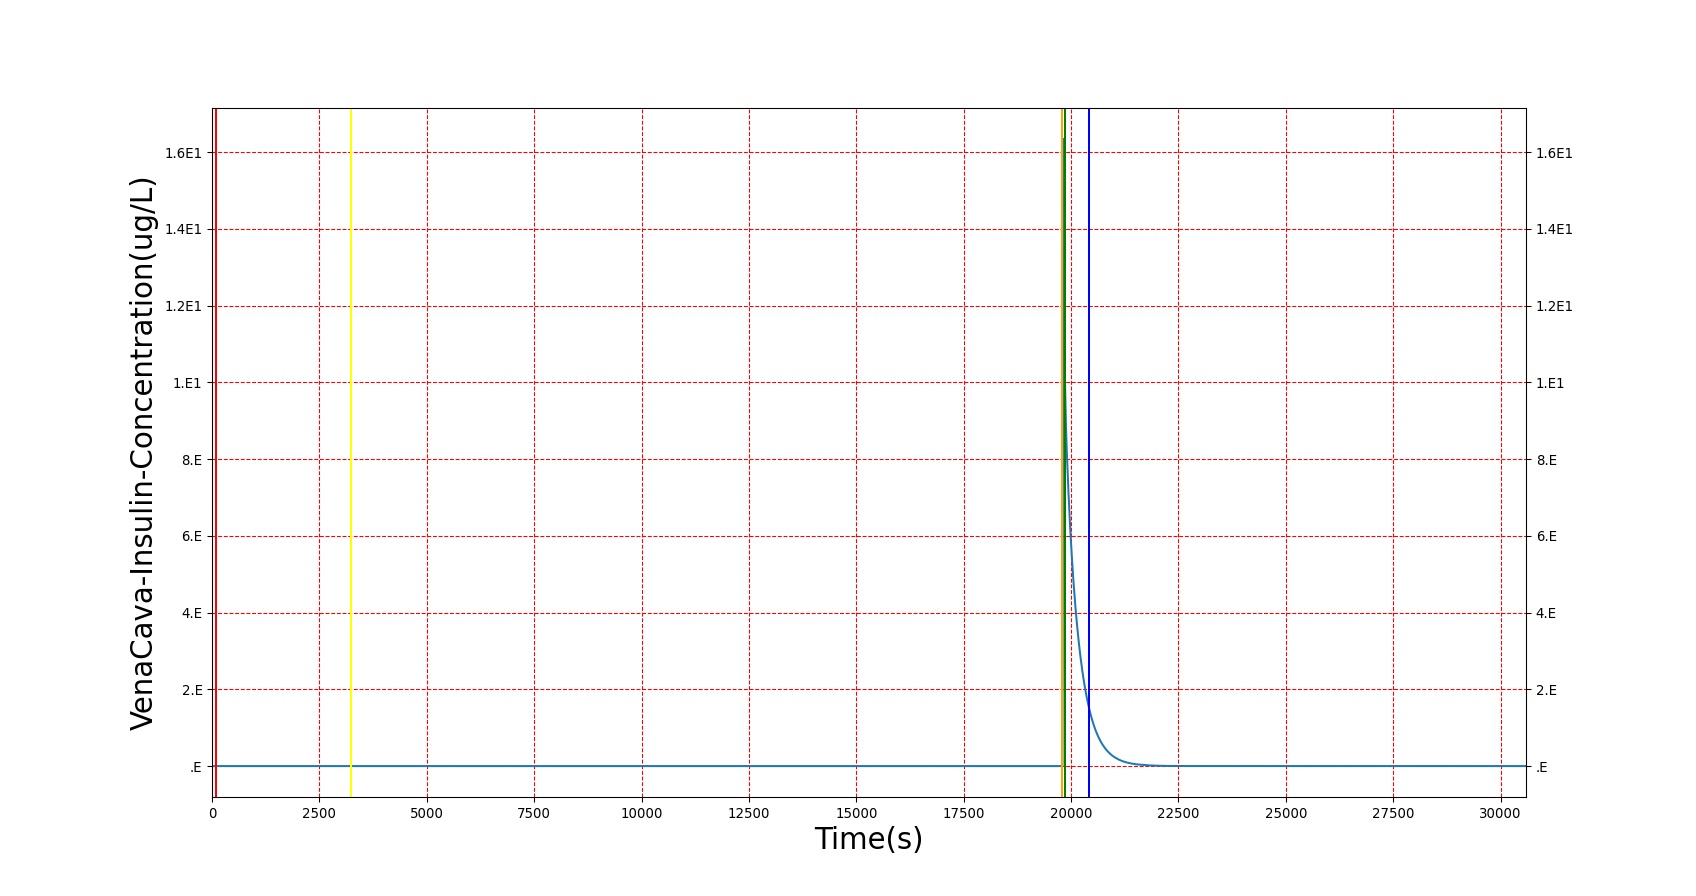
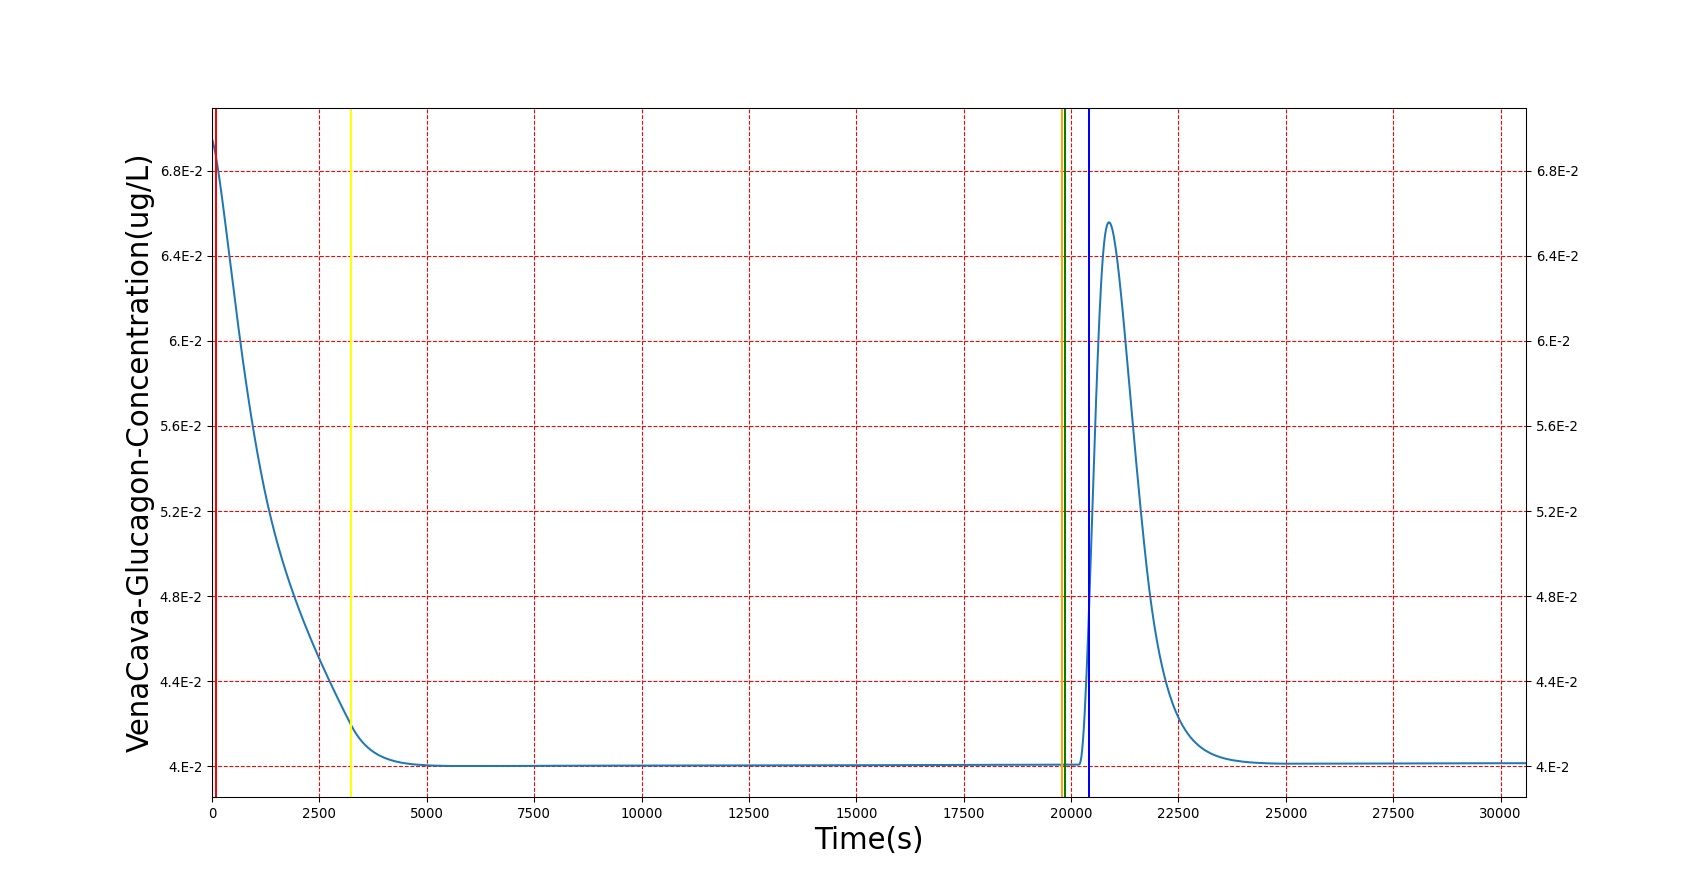
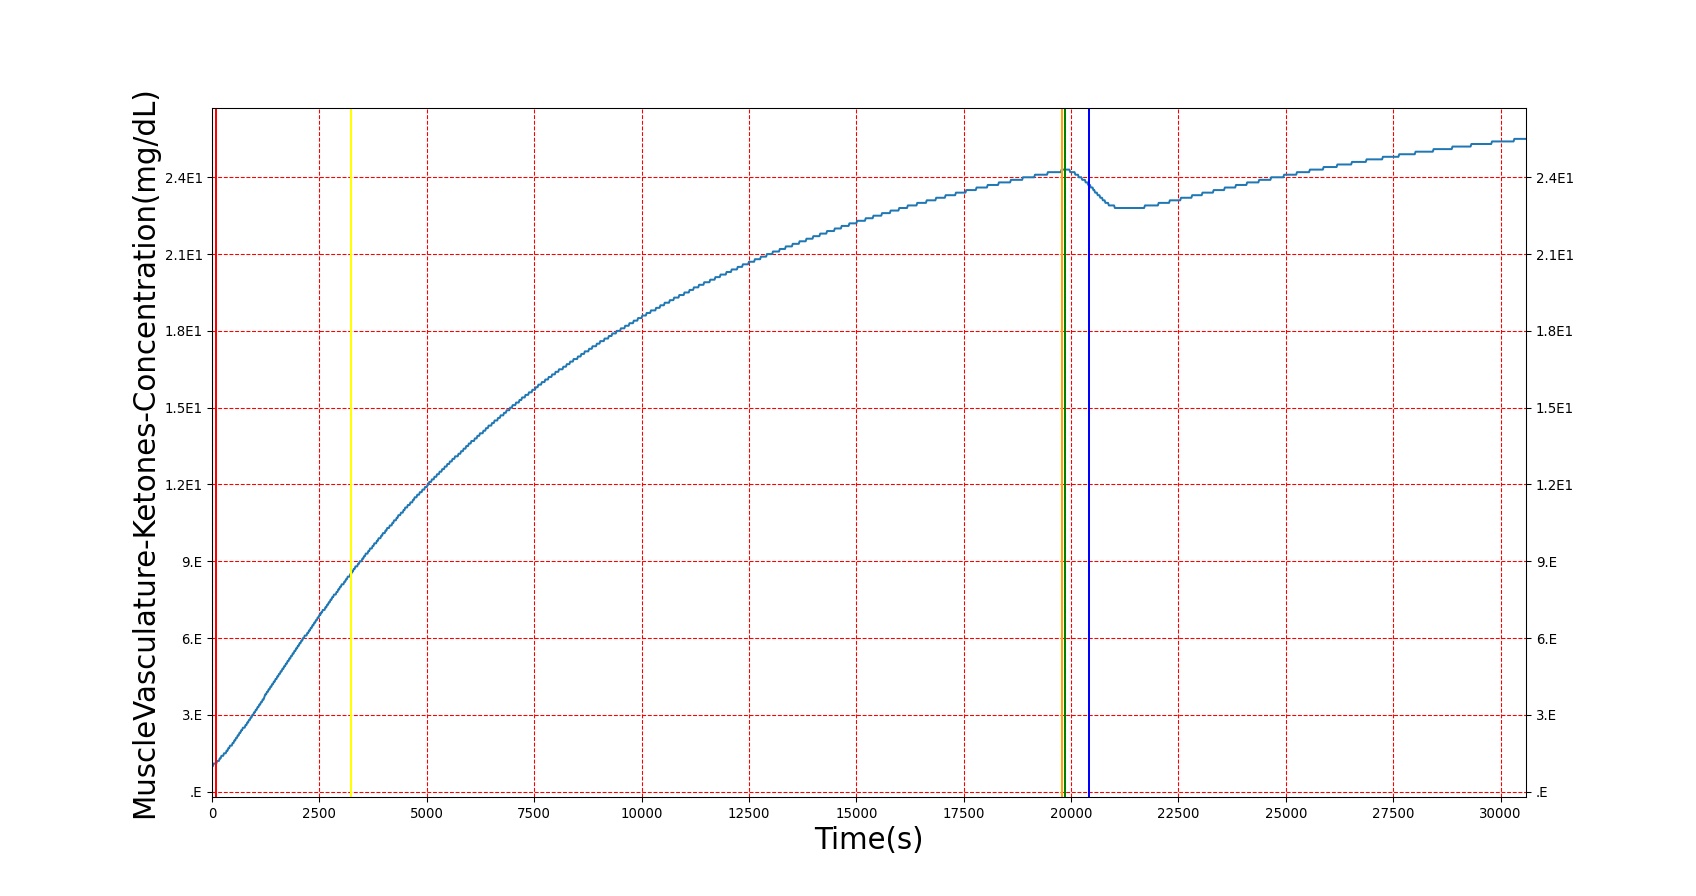
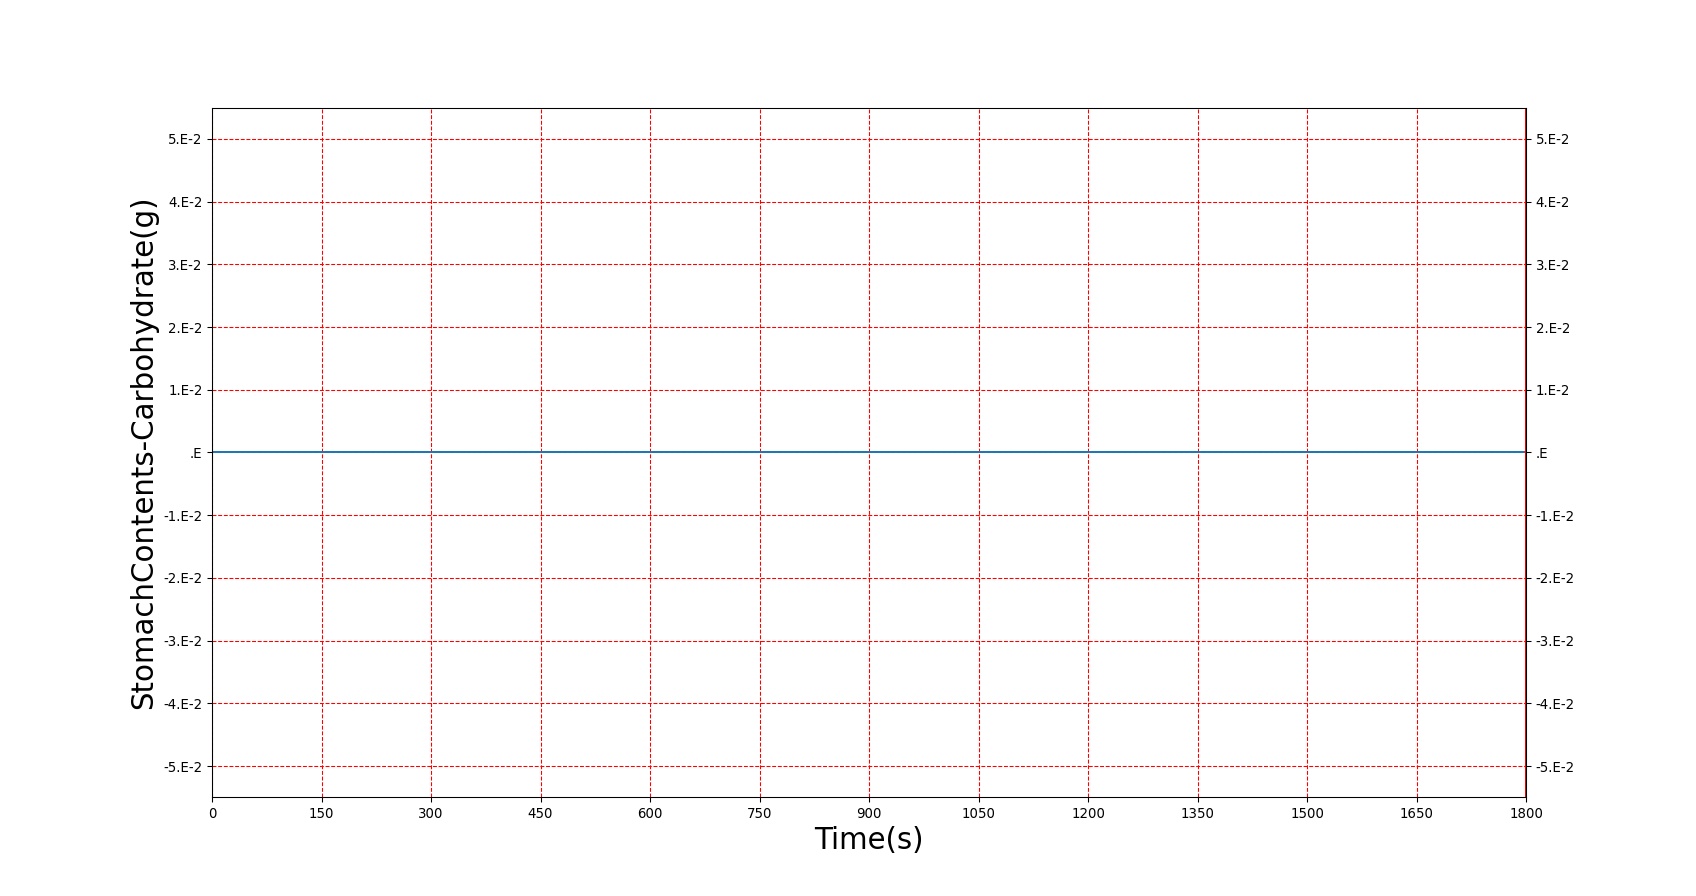
The diabetes type 1 condition exhibits the expected short-term results in BioGears. As shown in figure 4 below, a patient with a severity 1 diabetes type 1 condition sees an increasing trend in blood sugar over time. During this period, ketone production increases, reaching nearly ketotic levels. Glucagon concentration also drops in response to the high blood sugar, but not lower than around 40 ng/L. When insulin is administered, blood sugar drops, glucagon returns to near normal, and blood ketones dip, as expected.
| 
|
| 
|
| |
Diabetes Type 2
Diabetes mellitus type 2, also known as non-insulin-dependent diabetes mellitus, is a long-term disorder that has many of the same symptoms as type 1 diabetes. Rather than resulting completely from impaired insulin synthesis, however, the symptoms of type 2 diabetes also stem from the body's resistance to insulin. That is, the amount of insulin that would perfectly maintain the metabolic state of a healthy patient would have less of an effect on a patient with type 2 diabetes. Both insulin production impairment and insulin resistance combine to result in the behavior commonly classified as diabetes type 2 [155]. Similarly to type 1 diabetes, type 2 diabetes results in elevated blood glucose, but a differentiating point is the blood insulin, which is elevated in type 2 diabetes [134].
The diabetes type 2 condition in BioGears has two components: an insulin production impairment scale and an insulin resistance scale. The insulin production impairment severity is exactly as in diabetes type 1. The insulin resistance severity is also a 0 to 1 severity value, where 0 means that the patient responds to insulin in a normal fashion, and 1 means that insulin has no effect in the system. Whereas in diabetes type 1, the only model effects were limitations on insulin and glucagon production, in diabetes type 2, the insulin model is modified a bit. The normal insulin production curve in BioGears is based on [353], but because its range is restricted to relatively normal blood glucose levels, this had to be modified. An insulin production multiplier was introduced that scaled insulin production for very high glucose values, as seen in [134]. Figure 5 shows how insulin production is modified nonlinearly with increasing blood glucose.

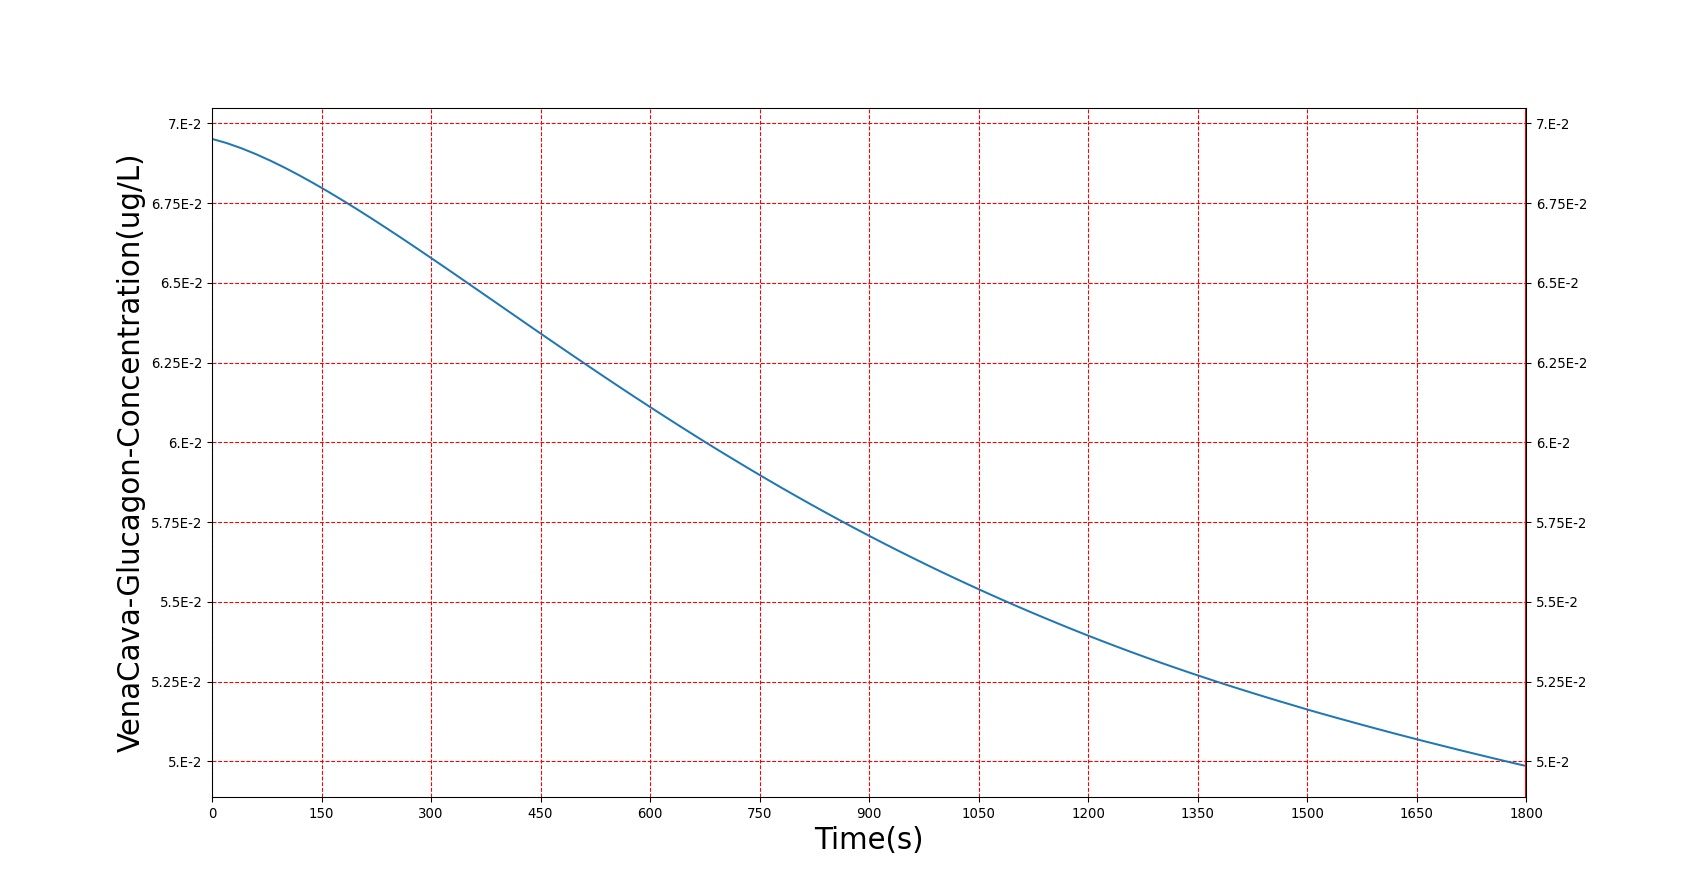
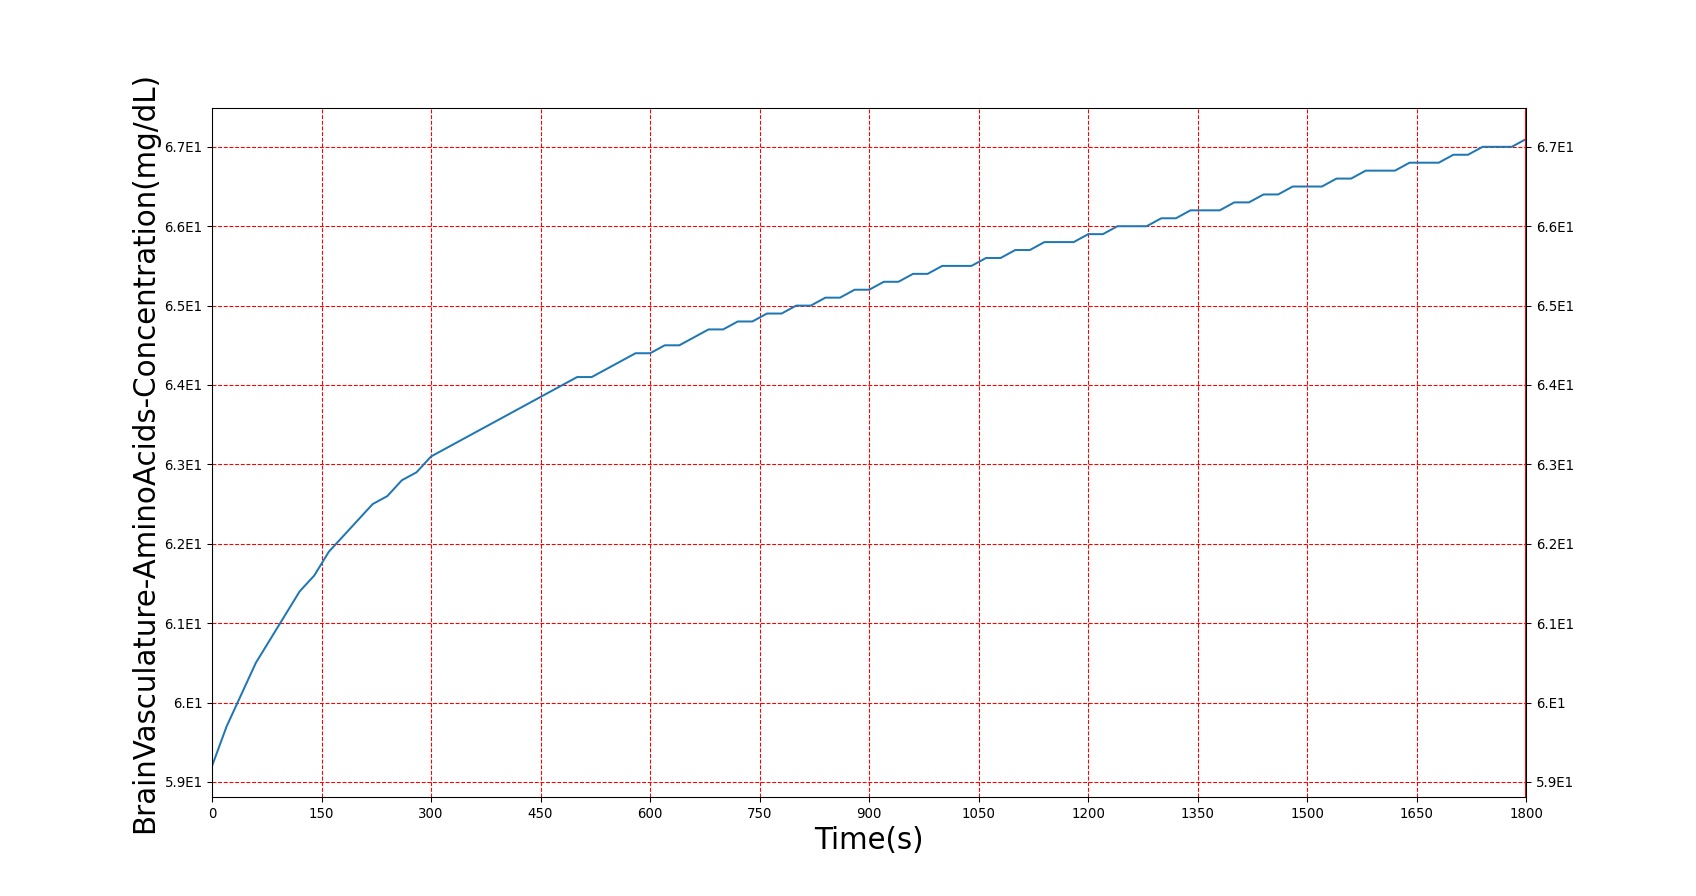
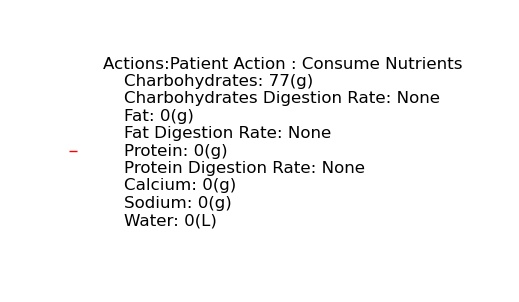
This curve accounts for the possibility of increased glucose, but the genesis of increased glucose is caused by the modification to the computed hormone factor. Because the effect of insulin resistance is the body needing more insulin to register an equivalent effect, the insulin resistance severity is used to scale down the insulin concentration used in the hormone factor calculation, lowering its effect. With this, the effects of insulin in BioGears (storage of glucose, deactivation of gluconeogenesis and ketogenesis, storage of fats and amino acids, etc.) are reduced, causing the elevated blood nutrients observed. Figure 6 shows the results of a glucose tolerance test on a patient with the diabetes type 2 condition. As expected, elevated glucose levels and amino acid levels are observed, and insulin response is much higher than in a non-diabetic patient. The slow return to lower blood glucose levels in diabetes type 2 is a known issue, and will be investigated in future releases.
| 
|

| 
|
| |
| |
Conclusions
The hormones included in the current Endocrine System provide a validated response to the effects modeled.
Future Work
Coming Soon
Recommended Improvements
-A larger hormone library, including sex-specific and reproductive hormones
Appendices
Data Model Implementation
Endocrine